Best Metrics to Measure the Success of an MVP


MVP, or Minimum Viable Product, is a term used in product development to describe the earliest version of a product that can be released to the market. According to Wikipedia, this version is designed to test the viability of the product, validate the market demand, and gather user feedback to inform future development. In this blog post, we will explore the key metrics that can be used to measure the success of an MVP and understand its impact on product development.
Making an MVP has the dual objectives of concept validation and product-market fit testing. It is a technique for cutting the cost of development and lowering the risk of creating a product that does not satisfy consumer expectations. When developing an MVP, it’s critical to keep in mind the fundamental features and functionality of the product, the target market, and user input.
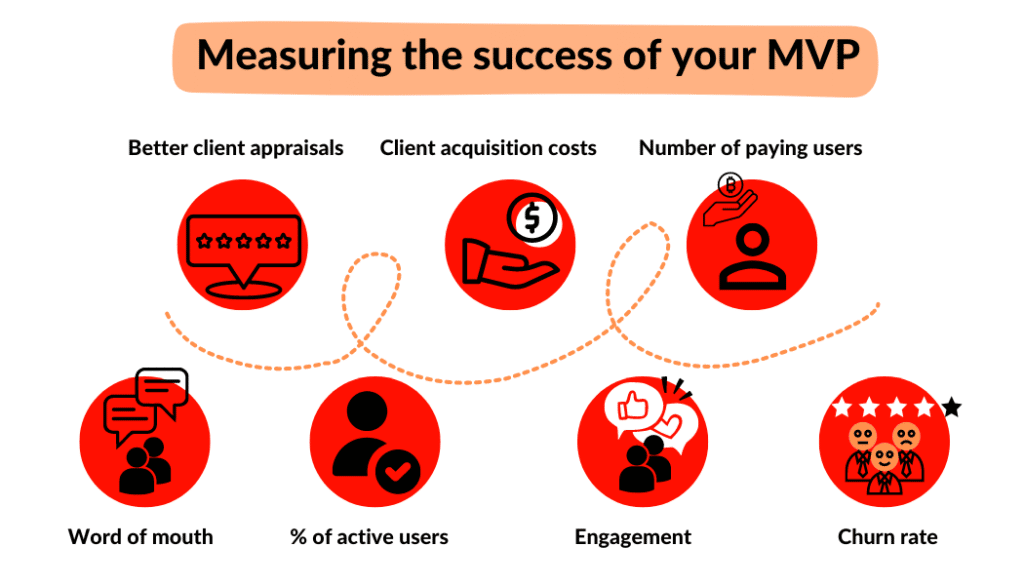
Measuring the Success of an MVPMeasuring the success of an MVP is critical to ensuring that it is meeting the goals and expectations set during its development. By tracking and analyzing key metrics, you can understand the impact of your MVP on the market, identify areas for improvement, and make informed decisions on future product development.
In this blog post, we will discuss five key metrics that can be used to measure the success of an MVP: User Acquisition Metrics, Engagement Metrics, Revenue Metrics, and Feedback Metrics.
If you would like to learn how to build an online marketplace MVP please read this blog post How to Build an Online Marketplace MVP.


User Acquisition Metrics are metrics that measure the success of user acquisition efforts and help to understand the user journey. These metrics help to determine the cost of acquiring a new user, the conversion rate, user retention, and lifetime value.
Acquisition Cost Per User (CAC)
Acquisition cost per user (CAC) is a key metric in user acquisition. It measures the cost of acquiring a new user and helps to understand the cost-effectiveness of user acquisition efforts. CAC is calculated by dividing the total cost of user acquisition by the number of unique users. According to Neil Patel, It is important to regularly track CAC to ensure that user acquisition efforts are optimized for maximum impact.
Conversion Rate
The conversion rate is another key metric in user acquisition. It measures the percentage of visitors who take a desired action, such as downloading your app, making a purchase or signing up for a newsletter. The conversion rate is calculated by dividing the number of conversions by the number of visitors. Understanding the conversion rate is critical to optimizing user acquisition efforts and increasing the number of new users.
User Retention
User retention is another key metric in user acquisition. It measures the percentage of users who return to the MVP after their first visit. User retention is calculated by dividing the number of users who return to the MVP by the number of new users. It is important to track user retention to understand the impact of user acquisition efforts on the long-term success of the MVP.
Lifetime value (LTV) is the final key metric in user acquisition. It measures the total value a user will bring to the MVP over the course of their lifetime. LTV is calculated by multiplying the average value of a user by the number of times they will use the MVP. Understanding LTV is critical to optimizing user acquisition efforts and maximizing the return on investment.
Engagement Metrics
Engagement Metrics are metrics that measure user engagement with the MVP. These metrics help to understand how users are interacting with the MVP and identify areas for improvement. Key engagement metrics include Active Users, Session Length, Bounce Rate, and Return Visits.
Active Users
Active Users is a metric that measures the number of users who are actively using the MVP on a regular basis. Active Users are calculated by dividing the number of users who have used the MVP in the last 30 days by the total number of users. It is important to track Active Users to understand the level of user engagement.
Calculating Active Users
Active users can be calculated by counting the number of unique users who have used a product in a given period of time, such as a week or a month.
Importance of Active Users in Measuring MVP Success
Active users provide a snapshot of the number of people using a product and their level of engagement. By regularly tracking this metric, companies can see if their product is growing or declining in popularity, and make informed decisions about how to optimize and improve their product.
Session Length
Session length is the amount of time a user spends using a product in one session. This metric provides insight into how engaged users are with the product and how much time they are spending using it.
Calculating Session Length
Session length can be calculated by dividing the total amount of time spent using the product by the number of sessions.
Importance of Session Length in Measuring MVP Success
Session length provides valuable information about user engagement with a product. A high session length indicates that users are engaged and using the product for a significant amount of time. On the other hand, low session lengths may indicate that the product is not meeting user needs or is not providing enough value to keep users engaged. Companies can use this information to optimize their product and improve user engagement.
Bounce Rate
Bounce rate is the percentage of users who leave a product after only visiting one page. This metric provides insight into how well a product is retaining users and how well it is meeting their needs.
Calculating Bounce Rate
Bounce rate can be calculated by dividing the number of users who leave a product after only visiting one page by the total number of users who visit the product.
Importance of Bounce Rate in Measuring MVP Success
The bounce rate offers crucial details about how users interact with a product. A high bounce rate means that users are leaving the product after only viewing one page because they are fast losing interest in it. This could mean that the product or user experience needs to be improved. A low bounce rate, on the other hand, shows that customers value the product and remain interested in it for a longer amount of time.
Revenue Metrics
Revenue metrics are a set of key performance indicators (KPIs) that measure the financial success of your MVP. These metrics provide valuable insight into how well your MVP is generating revenue and how it is performing financially.
Revenue metrics refer to the KPIs that measure the financial performance of your MVP. These metrics include key indicators such as average order value (AOV), gross margins, gross revenue, and net promoter score (NPS). These metrics provide valuable insights into how well your MVP is generating revenue and how it is performing financially.
It is important to understand the financial success of your MVP to make informed decisions on product development. By tracking revenue metrics, you can get a clear picture of how well your MVP is generating revenue, what is working well, and what areas may need improvement.
Ready to Start With an MVP?
Contact UsAverage Order Value (AOV)
The average order value (AOV) is the average amount of revenue generated per transaction. It is calculated by dividing the total revenue generated by the number of orders. This metric provides valuable insight into the average amount of revenue generated per transaction and can be used to measure the success of your MVP’s pricing strategy.
Calculating AOV
To calculate the average order value, simply divide the total revenue generated by the number of orders. For example, if your MVP generated $10,000 in revenue from 100 orders, the AOV would be $100 ($10,000 / 100).
Importance of AOV in Measuring MVP Success
The average order value is an important metric for measuring the success of your MVP’s pricing strategy. If the AOV is high, it means that your MVP’s pricing strategy is working well and generating a lot of revenue. If the AOV is low, it may indicate that your MVP’s pricing strategy needs to be reevaluated or that there is room for improvement in the pricing of your MVP’s products or services.
Gross Margins
Gross margins refer to the difference between the cost of goods sold (COGS) and the revenue generated by your MVP. It is calculated by subtracting the COGS from the revenue and dividing the result by the revenue. Gross margins are an important metric for measuring the financial performance of your MVP and can be used to make decisions on product development and pricing.
Calculating Gross Margins
To calculate the gross margins, subtract the cost of goods sold (COGS) from the revenue and divide the result by the revenue. For example, if your MVP generated $10,000 in revenue and the COGS was $5,000, the gross margins would be 50% ($5,000 / $10,000).
Importance of Gross Margins in Measuring MVP Success
Gross margins is an important metric for measuring the financial success of your MVP. If the gross margins are high, it means that your MVP is generating a lot of revenue relative to its costs. If the gross margins are low, it may indicate that the MVP needs to reevaluate its pricing strategy or that there is room for improvement in the cost structure of the MVP.
Gross Revenue
Gross Revenue, also known as total revenue, is the total amount of money generated from sales of a product or service, before deducting any expenses. It is a measure of the total sales generated by the MVP and does not take into account the cost of goods sold operating expenses, or other deductions.
Calculating Gross Revenue
Gross Revenue can be calculated by multiplying the number of units sold by the price of each unit. For example, if the MVP sells 100 units at $10 each, the gross revenue would be $1000.
Importance of Gross Revenue in Measuring MVP Success
Gross Revenue is an important metric for measuring the financial success of the MVP. It provides insight into the total sales generated and helps determine the overall financial viability of the MVP. By tracking gross revenue, startups can monitor the growth of their business and identify areas for improvement.
For evaluating the effectiveness of an MVP, revenue metrics like Gross Revenue are essential. Startups are able to make wise decisions about the future of their product thanks to these metrics, which offer insightful information about the financial feasibility and user satisfaction of the MVP. Startups can optimize their MVP to boost revenue and boost customer satisfaction by monitoring these KPIs, which will result in longer-term success.
Feedback Metrics
Feedback metrics are crucial in measuring the success of an MVP, as they help to gauge customer satisfaction and identify areas for improvement. These metrics are directly linked to the user experience and play a key role in the overall success of the MVP. Here are three important feedback metrics to track when measuring MVP success:
Customer Satisfaction (CSAT)
Customer satisfaction, or CSAT, measures how satisfied customers are with the product or service provided by the MVP. It is a quick and simple metric that helps to determine customer happiness with the MVP.
Calculating CSAT
CSAT is calculated by surveying customers and asking them to rate their overall satisfaction on a scale of 1 to 10. The average score is then used to determine the overall CSAT.
Importance of CSAT in Measuring MVP Success
CSAT provides valuable insights into the customer experience and helps to identify areas for improvement. A high CSAT score indicates that the MVP is meeting customer expectations and providing a positive experience, while a low score suggests areas for improvement.
Net Promoter Score (NPS)
Net Promoter Score (NPS) is a measure of customer loyalty and advocacy. It measures how likely a customer is to recommend the MVP to others.
Calculating NPS
NPS is calculated by surveying customers and asking them to rate their likelihood of recommending the MVP on a scale of 1 to 10. The average score is then used to determine the overall NPS.
Importance of NPS in Measuring MVP Success
NPS provides valuable insights into the level of customer loyalty and advocacy, and helps to identify areas for improvement. A high NPS score indicates that the MVP is providing a positive experience and meeting customer expectations, while a low score suggests areas for improvement.
Importance of tracking Feedback Metrics for MVP success:
- Understanding customer satisfaction with the MVP
- Identifying areas for improvement in the customer experience
- Measuring the success of customer engagement initiatives
- Optimizing the MVP to increase customer loyalty and advocacy.
Other metrics like Churn rate are important metrics to track, but were not included in the blog post as it focuses on metrics that help measure the success of an MVP. Churn rate is more relevant for measuring the success of a fully-fledged product, as it helps you understand the rate at which customers are leaving a product or service. In the context of an MVP, the focus is on getting users to engage and convert, rather than retaining them as customers over the long term.
ConclusionIn conclusion, tracking metrics is crucial for the success of any MVP. By measuring key metrics such as user acquisition metrics, engagement metrics, revenue metrics, and feedback metrics, you can gain a deeper understanding of your MVP’s performance and identify areas for improvement.
Understanding the financial success of your MVP through metrics like Gross Revenue and Gross margins can give you valuable insights into how well your MVP is resonating with your target market and how well it is generating revenue. CSAT and NPS are essential feedback metrics that can help you understand user opinions and experiences with your MVP. By tracking these metrics, you can make informed decisions to optimize your MVP and increase its chances of success. Overall, metrics play a vital role in the success of any MVP, and regularly tracking them can help you make data-driven decisions to take your MVP to the next level.
Custom MVP Development ServicesA2 Design team has the necessary experience as a full-cycle software development company to offer excellent MVP development services. We have completed over 100 projects to date. Professionals from A2 Design offer proactive cooperation strategies built on clear communication and a focus on the client’s unique business needs.

The organization, communication, and breadth of our competence are valued by our clients. We provide highly accurate road plans and adhere to the timetable within the shortest time frames because of meticulous planning.

- 7 Easy Steps To Build Your Startup
- 7 Practical Tips to Build an MVP for a SaaS Startup
- Are you looking for the best way to launch your start-up idea in 2025? Start with an MVP!
- How to Build an MVP for a SaaS Startup
- How to Build Online Marketplace MVP?
- Why Laravel is the Best PHP Framework for Startups?


